How to predict your business sales with Chronos 2
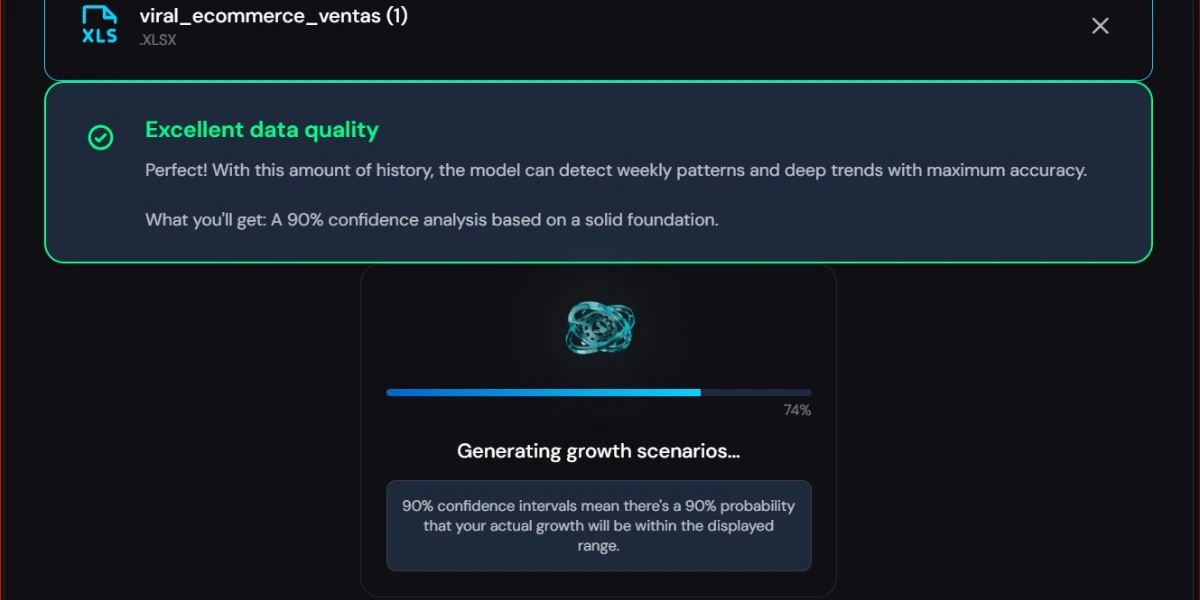
90% confidence intervals with Amazon Science technology operated by ApisDom.
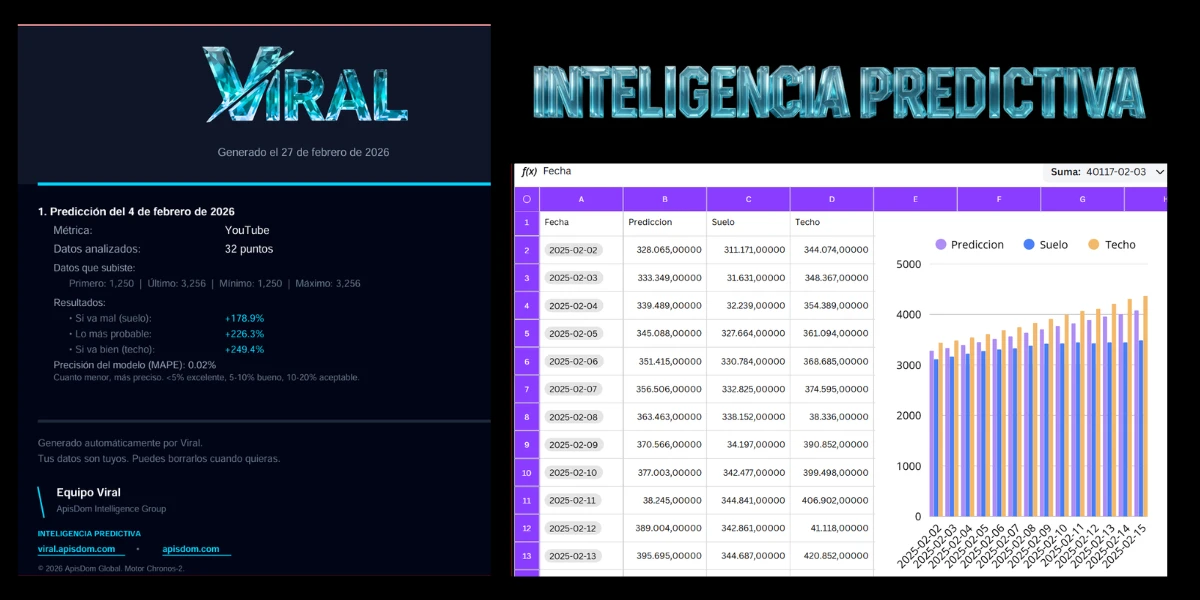
Viral in action
Watch how a CSV from YouTube Studio is uploaded and what the ApisDom engine returns.
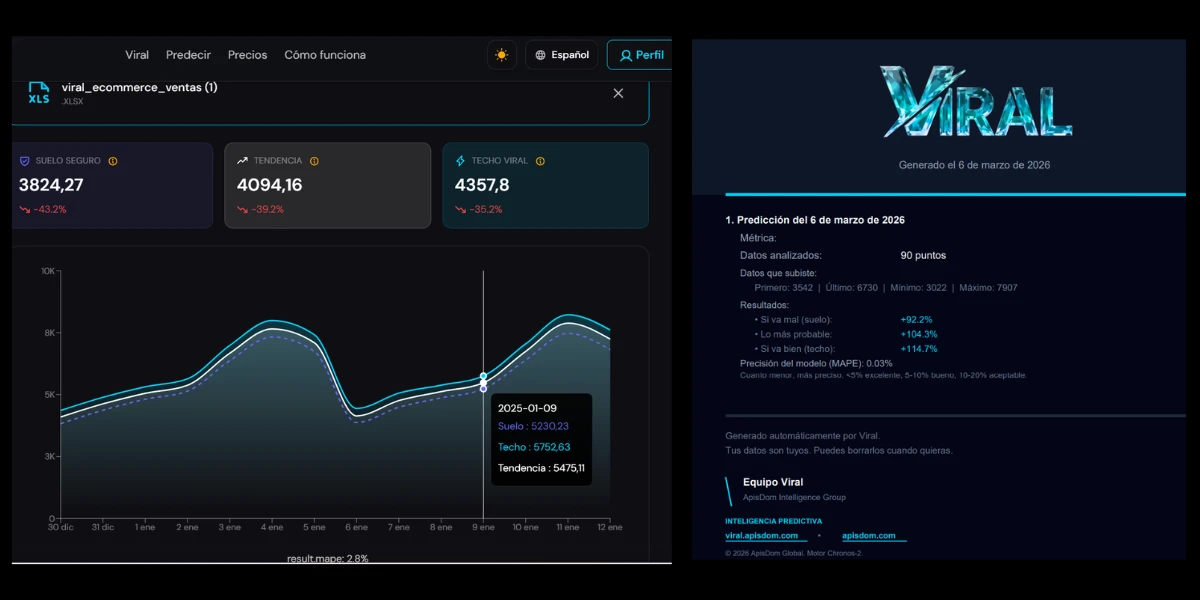
In this video we show a prediction generated with Viral.
We upload a file with historical data and the system calculates a 90% confidence interval using ApisDom and Chronos-2 technology.
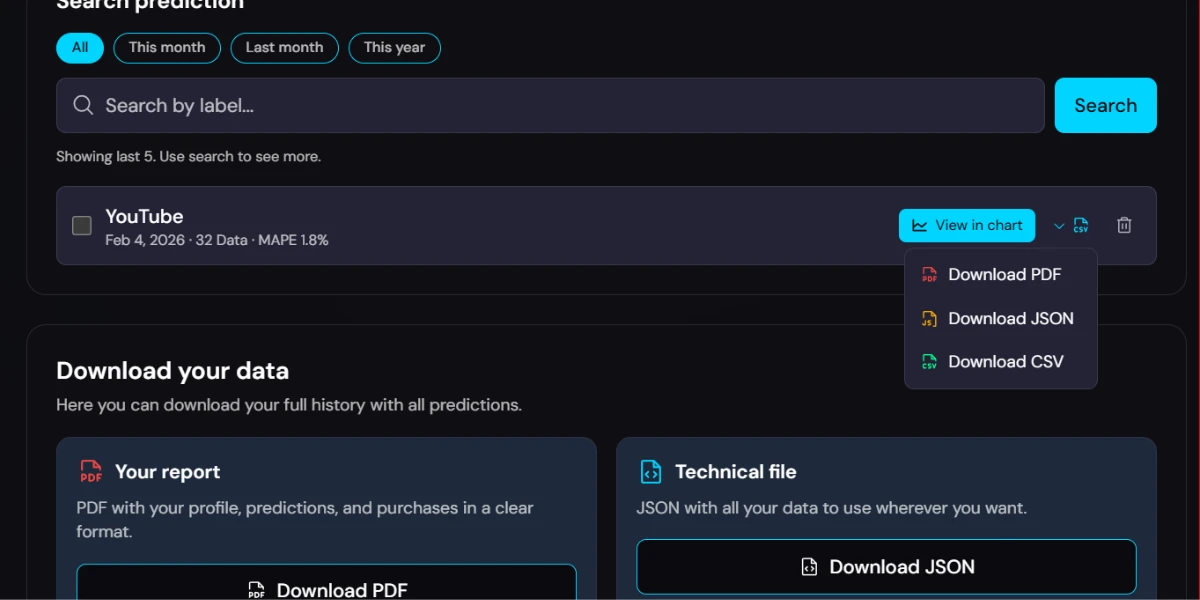
The result includes floor, trend and ceiling with export to PDF, CSV and JSON.
See ApisDom documentationAn analysis step by step
We upload historical data and the system generates a projection. No setup, no code.
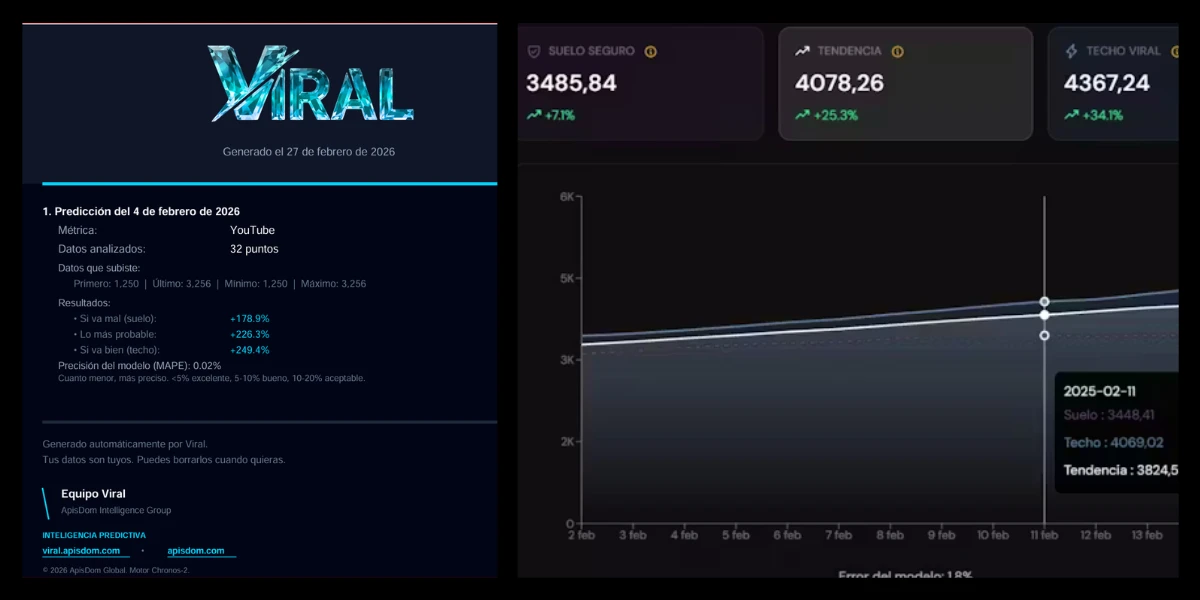
We uploaded 32 days of historical data. The system generated a 14-day projection. MAPE obtained: 1.83%. That means the model's average error on data it had not previously processed was below 2%.
| Date | Central projection | Conservative scenario | Optimistic scenario |
|---|---|---|---|
| 2025-02-02 | 3280,65 | 3111,71 | 3440,74 |
| 2025-02-05 | 3450,88 | 3276,64 | 3610,94 |
| 2025-02-10 | 3770,03 | 3424,77 | 3994,98 |
| 2025-02-15 | 4078,26 | 3485,84 | 4367,24 |
MAPE: 5.66% · Input data: 32 points · Horizon: 14 days
See pricingDemand forecasting for your online store
If you run an online store, the problem is not the sale. The problem is knowing how much you are going to sell before placing your supplier order. Too much stock ties up capital and drives up carrying costs. Too little stock causes stockouts that take sales and customers with them.
Ecommerce managers call this inventory distortion: the combined cost of holding overstock that does not turn over and running out of what does sell. Both cases have the same root: making purchasing decisions without demand forecasting.
Avoid stockouts
A stockout on a high-turnover product does not just lose that sale. It loses the customer who goes to find the same product elsewhere. Knowing when demand rises gives you time to adjust the reorder point before it happens.
Free up tied-up capital
A very large portion of any online store's capital is tied up in inventory. Carrying costs and storage costs accumulate on stock that does not turn over. A demand forecast tells you how much to buy, not how much seems prudent to buy.
Sync ads with real demand
Investing in ads just before a demand spike multiplies the return. Without a projection, you do not know when that spike is coming. With 14 days notice you can plan campaign budget against actual available stock.
Plan shifts and resources
Order spikes during peak season or after a campaign should not catch the warehouse team off guard. A 14-day projection lets you plan shifts and resources without resorting to emergency overtime.
Ecommerce in Spain exceeds 27 million active buyers. 77% of Spaniards buy online. Current forecasting solutions are expensive or require complex integrations. That is where Viral fits.
How to export your data by platform
| Platform | Where to export |
|---|---|
| Shopify | Shopify dashboard → Analytics → Export report CSV |
| WooCommerce | WooCommerce → Reports → Export |
| PrestaShop | PrestaShop → Modules → Statistics → Export |
| Google Analytics | Google Analytics → Reports → Conversions → Export |
You only need two columns: date and daily sales. That is all.
If your sales have been falling for months, the projection reflects that. The 90% confidence interval shows the range within which the real value is likely to move, not the range you would like to see.
Growth projection for your channel
The biggest concern for creators, regardless of channel size, is audience growth. Not whether they will grow. How much. And when.
The problem with data from YouTube Studio, TikTok Analytics or Instagram Insights is that it tells you what happened. Not what is going to happen. Viral takes that history and calculates where your curve is heading if the current trend holds.
Export your metrics. Upload them. The system returns a 14-day projection with three scenarios and the calculated margin of error.
YouTube
Views, subscribers and watch hours. Export from YouTube Studio → Analytics → Advanced mode. Project when you reach the next milestone: monetisation, 10K, 100K.
TikTok
Followers, plays and likes. Export from TikTok Analytics → Download data. See whether your growth is accelerating, slowing or stagnating.
Followers, reach and impressions. Export from Instagram Insights. Check whether your monthly growth rate is above or below the benchmark for your niche.
Other platforms
Twitch, Spotify, Substack or any platform that allows exporting data with date and value works with Viral.
If your sales have been fluctuating for months, the projection reflects that. The MAPE, the model's calculated error, appears alongside the result so you can judge how much weight to give it.
How many bookings will you have in August?
Upload your booking, occupancy or daily revenue history and get a forecast for the next two weeks. Plan staff, purchases and stock before the peak arrives.
A restaurant that knows it will have 40% more occupancy next week can call in backup on time. One that does not know improvises and loses quality and margin.
Predict your MRR before the investor meeting.
Upload your monthly revenue, active users or any metric you track month by month, and get a projection with real confidence intervals. Not an Excel model with optimistic assumptions.
In a funding round, showing a forecast based on real historical data with a visible error margin says more about team maturity than any pitch deck.
When will you reach 10,000 readers?
If you have a blog, a newsletter or a digital publication, your visit or subscriber data are time series. Upload them and get a 14-day growth forecast.
Predict my audience, freeThree steps
01
Export your data
Download a CSV from your platform: YouTube Studio, TikTok, Instagram, Shopify, WooCommerce or any other.
02
Upload it to Viral
CSV or Excel. The system detects the format automatically.
03
Receive the projection
Three scenarios for the next 14 days with 90% confidence intervals and the model's calculated error.
Once your data is ready, you can run your first prediction for free or check the credit packs to keep using Viral on a regular basis. The whole stack, from the validation API to the inference call and the final report delivery, runs on microservices owned and operated by ApisDom.
How the projection is calculated
Viral is ApisDom technology. To produce the predictions, ApisDom integrates Chronos 2, an Amazon Science model. ApisDom provides all the technology that makes it work. Your data is not used to train the model, only to generate your prediction.
Technology layers
- Technology, infrastructure and operation byApisDom
- Mathematical inference engine:Amazon Science
- Chronos 2 model (open source):github.com/amazon-science/chronos-forecasting
| Parameter | Value |
|---|---|
| Provider | ApisDom | Transparent Chronos 2 |
| Chronos 2 engine | Chronos-2 · Amazon Science |
| Minimum points | 10 |
| Recommended | 30 or more |
| Maximum | 5,000 points |
| Maximum horizon | 365 periods |
| Confidence interval | 90% · 5th and 95th percentiles |
| Typical response time | 2 to 15 seconds |
| First call after inactivity | 20 to 30 seconds |
| Seasonality detection | Automatic |
What is the MAPE
MAPE (Mean Absolute Percentage Error) is the model's average error calculated on historical data we set aside before making the projection. The lower it is, the closer the projection was to what actually happened.
| MAPE | Interpretation |
|---|---|
| < 5% | Excellent fit |
| 5% – 10% | Good fit |
| 10% – 20% | Acceptable fit |
| 20% – 40% | Low fit |
| > 40% | Unreliable result |
How to export your data
Export your metrics from any platform. The system recognises the format and calculates the projection automatically.
YouTube Studio
- Go to YouTube Studio
- Go to Analytics → Advanced mode
- Select the metric: views, subscribers or watch hours
- Choose the date range. Minimum 30 days
- Click Export and download the CSV
TikTok Analytics
- Go to your profile → Analytics
- Select Overview or Content
- Press Download data
Instagram Insights
- Go to Insights → Overview
- Select the period
- Export or copy the values manually
Formats Viral accepts
| Format | Extension | Separator |
|---|---|---|
| Standard CSV | .csv | Comma |
| European CSV | .csv | Semicolon |
| Excel | .xlsx / .xls | - |
- Fewer than 10 points: the analysis is blocked. No credits are consumed.
- Between 10 and 29 points: the analysis can run, but the margin of error will be larger.
- 30 points or more: adequate volume for a high-precision projection.
The file must have a single sheet with two columns: the first with dates in 2024-01-01 format and the second with numeric values.
If the file cannot be processed, no credits are consumed.
Download a sample file
If you want to see the exact format before preparing your data, download this file. It has 60 days of data with the structure Viral expects.
Frequently asked questions
The first two predictions are completely free. No credit card required. After that, it works with credits valid for 12 months from purchase.
Free PDF course
From eyeballing sales to forecasting demand with ApisDom technology
Free demand forecasting course for stores, ecommerce, creators and small businesses. Covers how to interpret forecasts, scenarios, the reliability traffic light and Amazon Chronos-2 without coding.
PDF · 4.92 MB · English · No registration
Download course (4.92 MB)The first 2 predictions are free
No credit card. No setup. Just your data and the result.
Know someone who could use this? Pass it on.